After meeting with stakeholders and auditing their existing products, and brand guidelines, I recommended the team create a data visualization system to achieve consistency and adhere to their newly unveiled brand guidelines. These are some of the dashboards I redesigned using Adobe XD for visuals and assets and Axure RP for prototyping.
Data visualization is a powerful tool that can be used to make complex information more accessible. The resulting visuals are designed with two goals: making it easy for viewers to compare data and telling stories about how this usage impacts decisions they might have trouble figuring out on their own.
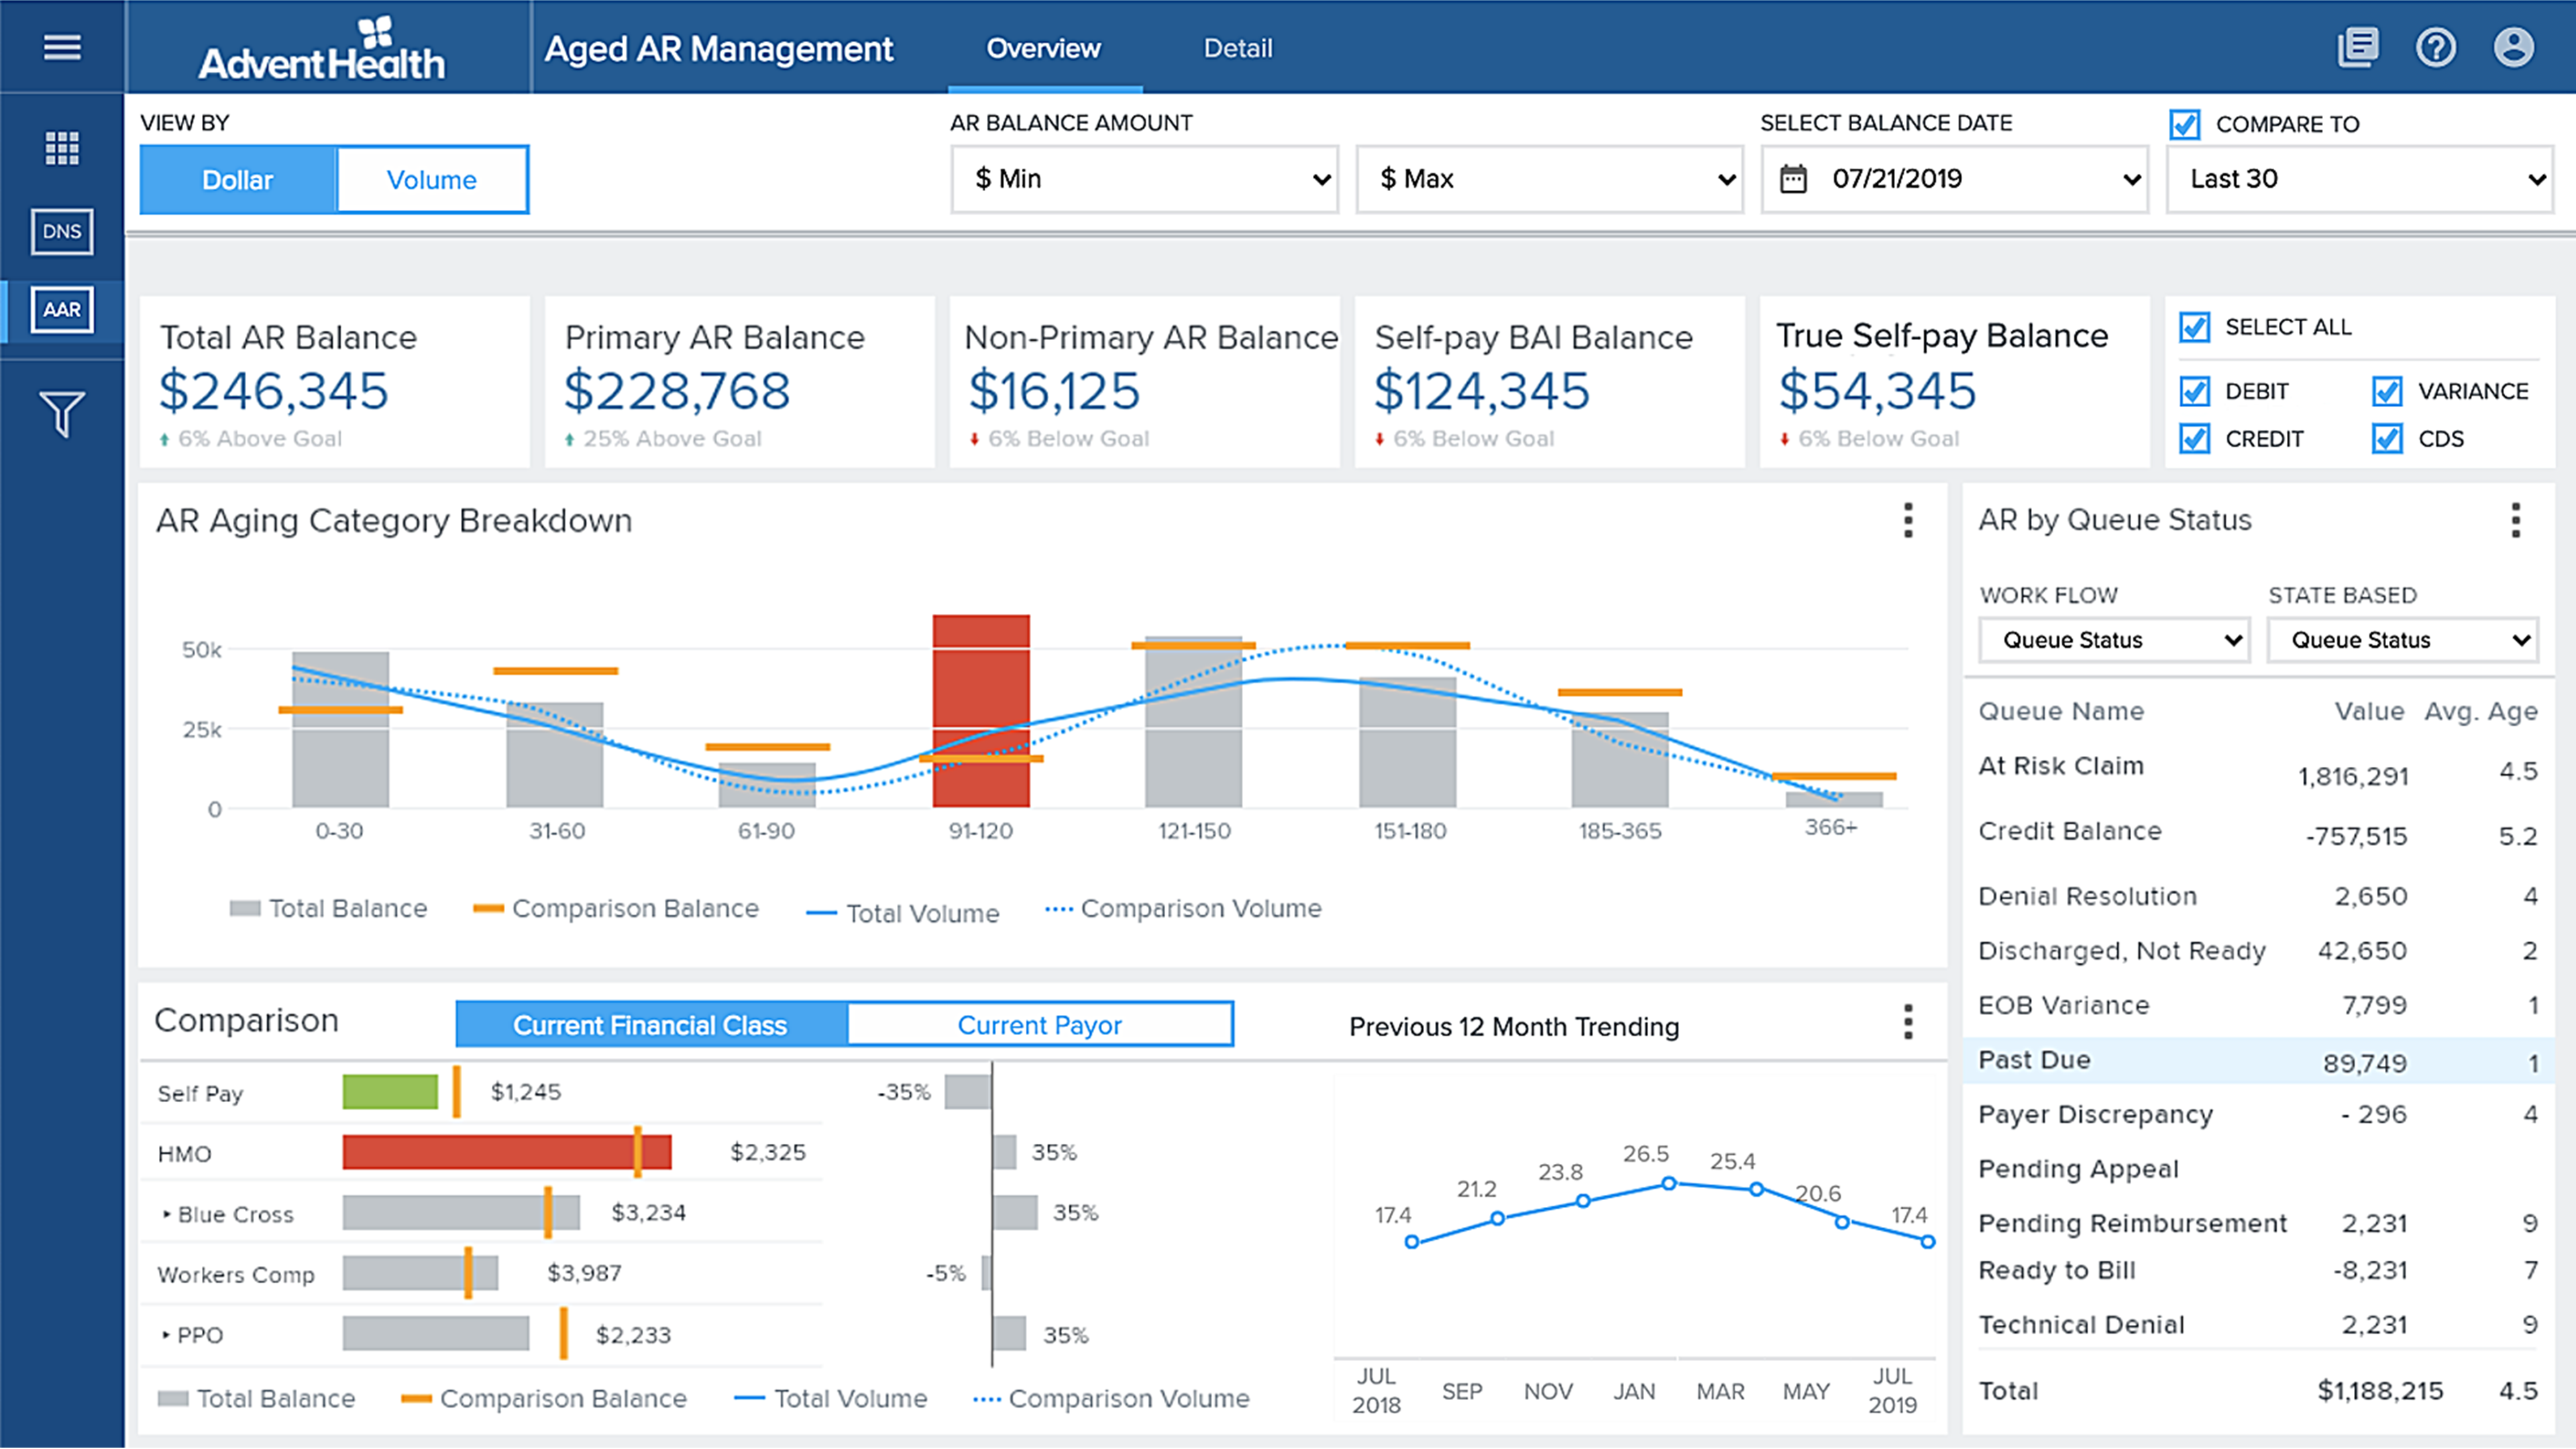
A dashboard’s purpose is to provide an overview of critical data, but it should also be designed for ease of use. Its design reflects how you may want to explore your information with different uses in mind – whether creating presentations or deeply examining numbers on a spreadsheet.
The operations dashboard was designed to help stakeholders keep track of current progress and identify any problems with the system. These will be typically used for monitoring, past or real-time, which means that it has basic information organized into simple charts so users can view their status at a glance. Too much information or details may overload users. Filters make reviewing past data or making sub-sets of data easy.